Using DevTracer with .NET
The .NET framework provides in namespace System.Diagnostics all classes required for tracing: the
classes Trace and Debug with methods Write,
WriteLine, Indent,
and Unindent .
The main difference between the classes is: Debug
applies only to the debug version of the application, Trace
applies to debug and release versions.
Trace and Debug are very flexible concerning the targets
of the trace information. The targets of trace information are
Tracelisteners. Some
trace listeners are included with .NET, like the TextWriterTraceListner
and the DefaultTraceListener.
The later is responsible for sending trace information to the output window of Visual Studio.
DevTracer Component is a TraceListener.
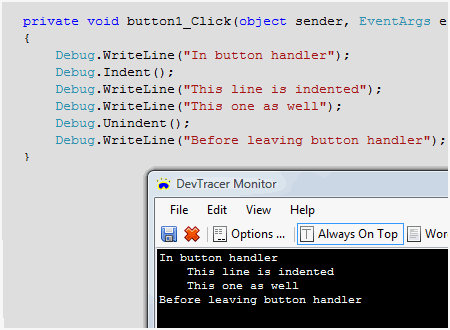
The following image shows some simple code in C# and the output it generates in
DevTracer Monitor.

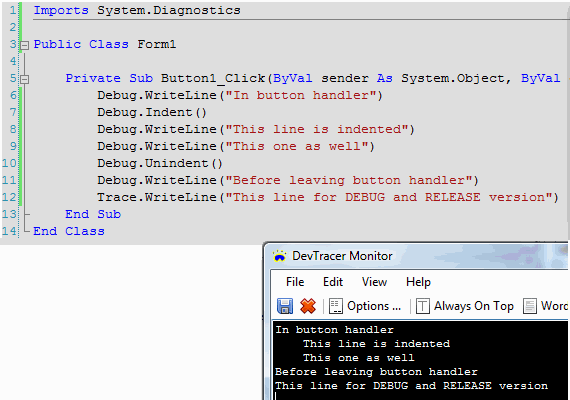
And an example for Visual Basic.NET:

DevTracer component and its TraceListener
are implemented in assembly NRSoftware.Tracer.dll.
During setup of DevTracer this assembly is added to the
Global Assembly Cache. Therefore it is accessible to all applications.
There are three techniques to prepare an application to use DevTracer:
-
Add a reference to NRSoftware.Tracer.dll. This approach
is not recommended. It requires that NRSoftware.Tracer.dll is distributed with the
application, because the application will not run without this assembly. Adding
a reference is not explained here, because the other options provide more flexibility.
-
Add some lines to your application’s configuration file. For ASP.NET applications
the lines have to be added to WEB.CONFIG.
-
Add some code to your application which is called once when the application is started.
DevTracer component's TraceListener
is loaded using reflection.
Using a Configuration File
Add the following lines to your configuration file:
<configuration>
 <system.diagnostics>
  <trace autoflush="false" indentsize="4">
   <listeners>
    <add name="myListener"
         type="NRSoftware.Tracer.Listener,NRSoftware.Tracer, Version=1.0.0.0, Culture=neutral, PublicKeyToken=867dfab712f16c0b"
         initializeData="localhost:12345" />
    <remove name="Default" />
   </listeners>
  </trace>
 </system.diagnostics>
</configuration>
These lines have to be added if you didn’t have a configuration file. If you already
have one, the <configuration> and
</configuration> tags of course must not be added again.
The value for initilizeData is very important: it
specifies the DevTracer Monitor IP-address to use (in this
example localhost, which is the same as 127.0.0.1) and the port number (here 12345).
The line <remove name=”Default” /> is optional.
It removes the listener which sends diagnostics output to the output window of Visual
Studio.
Warning: if you use your application with the configuration file on a computer which
does not have DevTracer Component installed, an exception
will be thrown when trace information is generated for the first time using one
of the Trace or Debug
methods.
The procedure is the same for ASP.NET applications. For ASP.NET add
the lines to WEB.CONFIG.
The main advantage of using a configuration file is that you can use
DevTracer with an existing application without touching the code, provided
that the application is using
Trace or
Debug to generate trace information.
Using Reflection
The listing below shows a class which loads the TraceListener
of DevTracer component using reflection:
using System;
using System.Diagnostics;
using System.Reflection;

namespace NRSoftware.DevTracer
{
    public static class TracerInit
    {
        private static bool _tryedLoadinListenerBefore = false;

        public static void InitListener()
        {
            if (_tryedLoadinListenerBefore) return;
            _tryedLoadinListenerBefore = true;
            try
            {
                string assemblyFullName = "NRSoftware.Tracer, Version=1.0.0.0, Culture=neutral, PublicKeyToken=867dfab712f16c0b";
                // load assembly -- throws an exception if DevTracer Component not installed
                Assembly ass = Assembly.Load(assemblyFullName);

                object[] args = new object[1];
                args[0] = "localhost:12345";    // initializeData
                // create instance of class derived from TraceListener
                object obj = ass.CreateInstance("NRSoftware.Tracer.Listener", false, BindingFlags.Default, null, args, null, null);

                // optional : set application name
                args[0] = "MyApplication";
                obj.GetType().InvokeMember("ApplicationName",
                    BindingFlags.Public | BindingFlags.Instance | BindingFlags.SetProperty,
                    null, obj, args);

                TraceListener li = obj as TraceListener;
                Trace.Listeners.Add(li);                // add listener
                li.IndentSize = 8;                      // set indentsize

                // the following line is optional - it removes the default trace listener
                Trace.Listeners.Remove("Default");
            }
            catch (Exception ex)
            {
                // do nothing if DevTracer Component not installed
            }
        }
    }
}
Add this class to your project. You must call TracerInit.InitListener()
once in your application. If you develop a Windows Forms application,
Main() is a good place.
For ASP.NET applications you can call this method in
Application_Start() of the Global Application class.