Using DevTracer with C++
When we talk about C++ here, we mean native code
generation. With Microsoft Visual Studio® .NET it
is also possible to generate managed code with C++. When generating managed code,
the way to use DevTracer is the same as when using C# or Visual Basic.NET.
For native code DevTracer provides a COM component for generating
the trace information. With Microsoft Visual C++ there
are several approaches for using a COM-component. There is the MFC class wizard,
which easily creates a wrapper class from a type library, and there is
ATL.
Here we will first show an example how to use DevTracer
with MFC. Microsoft Visual Studio.NET 2005 was used,
but the procedure is very similar in Visual C++ Version 6
or other versions of Visual Studio.NET. Then we
will show how it is possible to redirect the output of the MFC
TRACE statement to DevTracer.
Using DevTracer with MFC
First create a new MFC application using the wizard of Visual Studio. Then add a
wrapper class for DevTracer component. To do this, select
menu Project → Add Class .... In the dialog
displayed select MFC → MFC class from TypeLib
and choose the type library NRSoftware_Tracer_COM.
The type library contains only one interface (IDevTracer).
Select that one. A class will be generated which should be the same as the following
listing:
// Machine generated IDispatch wrapper class(es) created with Add Class from Typelib Wizard

#import "c:\\program files\\NRSoftware\\DevTracer\\NRSoftware.Tracer.COM.tlb" no_namespace
// CDevTracer wrapper class

class CDevTracer : public COleDispatchDriver
{
public:
	CDevTracer(){} // Calls COleDispatchDriver default constructor
	CDevTracer(LPDISPATCH pDispatch) : COleDispatchDriver(pDispatch) {}
	CDevTracer(const CDevTracer& dispatchSrc) : COleDispatchDriver(dispatchSrc) {}

	// Attributes
public:

	// Operations
public:


	// IDevTracer methods
public:
	void Init(LPCTSTR server, long port)
	{
		static BYTE parms[] = VTS_BSTR VTS_I4 ;
		InvokeHelper(0x1, DISPATCH_METHOD, VT_EMPTY, NULL, parms, server, port);
	}
	void put_ApplicationName(LPCTSTR newValue)
	{
		static BYTE parms[] = VTS_BSTR ;
		InvokeHelper(0x2, DISPATCH_PROPERTYPUT, VT_EMPTY, NULL, parms, newValue);
	}
	void Write(LPCTSTR s1)
	{
		static BYTE parms[] = VTS_BSTR ;
		InvokeHelper(0x3, DISPATCH_METHOD, VT_EMPTY, NULL, parms, s1);
	}
	void WriteLine(LPCTSTR s1)
	{
		static BYTE parms[] = VTS_BSTR ;
		InvokeHelper(0x4, DISPATCH_METHOD, VT_EMPTY, NULL, parms, s1);
	}
	void Indent()
	{
		InvokeHelper(0x5, DISPATCH_METHOD, VT_EMPTY, NULL, NULL);
	}
	void Unindent()
	{
		InvokeHelper(0x6, DISPATCH_METHOD, VT_EMPTY, NULL, NULL);
	}
	void put_IndentSize(long newValue)
	{
		static BYTE parms[] = VTS_I4 ;
		InvokeHelper(0x7, DISPATCH_PROPERTYPUT, VT_EMPTY, NULL, parms, newValue);
	}

	// IDevTracer properties
public:

};
This generated class is just a wrapper for the IDispatch
interface.
Now we derive a class MyTracer from the generated
one. This class is a Singleton, i.e. it ensures
that only one instance will be created.
#include "CDevTracer.h"

class MyTracer : public CDevTracer
{

private :
	static MyTracer* _instance;

	MyTracer();

public :
	static MyTracer*  Get();

};#include "stdafx.h"
#include "MyTracer.h"
MyTracer* MyTracer::_instance = NULL;
MyTracer::MyTracer()
{
CreateDispatch(_T("NRSoftware.DevTracer"));
///
/// Set server name (DevTracer Monitor) and port number
///
Init(_T("localhost"),12345);
}
MyTracer* MyTracer::Get()
{
if (_instance == NULL)
_instance = new MyTracer();
return _instance;
}
Note the call of method Init(). The IP-address is
set to localhost, the port number to
12345. These are the settings DevTracer Monitor
is listening to.
Using Class MyTracer Directly
Listing MyTracerDemo.cpp shows how class
MyTracer can be used.
#include "MyTracer.h"
.
.
.
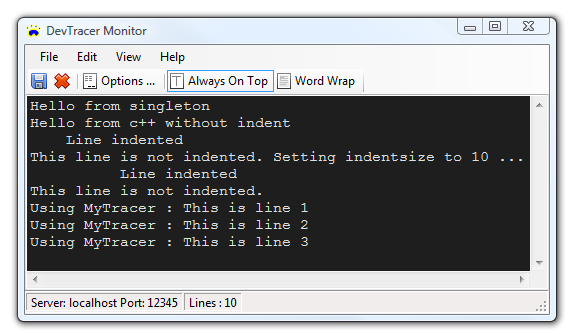
MyTracer *dt = MyTracer::Get();
dt->WriteLine(_T("Hello from c++ without indent"));
dt->Indent();
dt->WriteLine(_T("Line indented"));
dt->Unindent();
dt->Write(_T("This line is not indented. "));
dt->WriteLine(_T("Setting indentsize to 10 ..."));
dt->put_IndentSize(10);
dt->Indent();
dt->WriteLine(_T("Line indented"));
dt->Unindent();
dt->WriteLine(_T("This line is not indented. "));
for (int i=1 ; i<=3; i++)
{
wchar_t buffer[100];
swprintf_s(buffer,100,_T("Using MyTracer : This is line %d"),i);
dt->WriteLine(buffer);
}
And this image shows the trace information in DevTracer
Monitor.
Using the MFC TRACE Statement
MFC has some build in trace capabilities. The statement
int x = 16;
TRACE( "The value of x is %d\n", x );
will produce The value of x is 16 in the output
window of Visual Studio.
The TRACE statement uses the object afxDump, which
is an instance of class CDumpContext. This object
can be used to send the contents of all TRACE statements to DevTracer
Monitor.
afxDump has a member m_pFile
of type CFile. For using DevTracer
we have to create a new class derived from CFile.
#pragma once
#include "afx.h"
#include "MyTracer.h"

class MyFileTRACE : public CFile
{
public:
	MyFileTRACE(void)
	{
		_tracer = MyTracer::Get();

	}

	~MyFileTRACE(void)
	{
		delete _tracer;
	}

	void Write(const void* lpBuf, UINT nCount)
	{
		TCHAR *source = (TCHAR*)lpBuf;
		TCHAR *buffer = new TCHAR[2*(nCount+1)];
		TCHAR *temp = buffer;
		while (nCount != 0)
		{
			if (*source == '\n')
			{
				*temp++='\r';
			}
			*temp++ = *source++;
			nCount--;
		}
		*temp = 0;
		_tracer->Write(buffer);
		delete buffer;
	}

private:
	MyTracer *_tracer;
};
This class is very simple. The most complex part is method
Write. Most developers us a \n as line
delimiter, but DevTracer expects a \r\n.
Therefore the Write method prepends a
\r before each \n.
Now we have to tell afxDump about our class.
afxDump.m_pFile = new MyFileTRACE();
A good place to add this line is the Application
class in the InitInstance() method. Make sure to
add the line after the call to AfxOleInit().
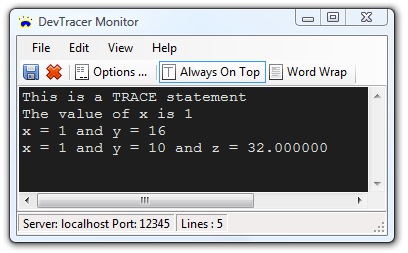
Example Using the TRACE Macro
int x = 1;
int y = 16;
float z = 32.0;

TRACE( "This is a TRACE statement\n" );
TRACE( "The value of x is %d\n", x );
TRACE( "x = %d and y = %d\n", x, y );
TRACE( "x = %d and y = %x and z = %f\n", x, y, z );
will produce this output in DevTracer Monitor.
But the same can be done using afxDump with operator <<. Here is the code:
int x = 1;
int y = 16;
float z = 32.0;

afxDump << "This is a TRACE statement\n";
afxDump << "The value of x is " << x << "\n";
afxDump << "x = " << x << " and y = " << y << "\n";
afxDump << "x = " << x << " and y = " << y << " and z = " << z << "\n";